Training that keeps pace with innovation, for a world that changes fast.
Learn Power BI, Excel, Python and data analysis with a practical and clear method. Even the most complex concepts become useful tools, immediately.
Request Free CallTransform data into interactive charts and clear answers: discover immediately what really matters to you.
Unify all your business data in one integrated platform: data warehouse, analytics and AI in a single environment.
Conquer complex datasets with elegant code: transform numerical chaos into winning strategies.
Give value to your numbers with intelligent tools to organize, analyze and get real-time solutions.
Put artificial intelligence to work: get predictions, suggestions and answers you once thought impossible.
Hi, I'm Barbara Callegari and for over 10 years I've been helping professionals, companies and students understand (and actually use) tools like Power BI, Excel, Python and artificial intelligence applied to data. I'm a Microsoft certified trainer and Python Associate certified, but above all I'm a person who loves making complex concepts simple. In every course, whether live or recorded, I have only one goal: to transform theory into practical skills, useful in everyday work.

Years of Experience


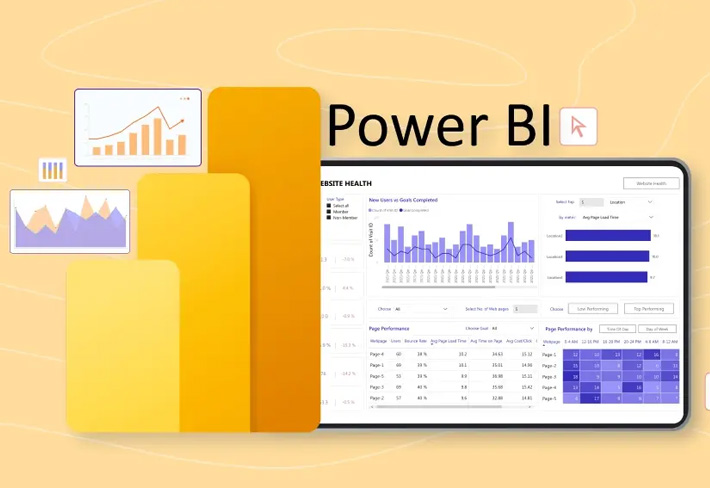
Learn Power BI at your own pace: from fundamentals to advanced techniques for creating professional reporting.
Explore data analysis with Python: pandas, numpy, matplotlib and practical projects to master the language.
Master Excel in daily work, with focus on efficiency, precision and data analysis.
I help professionals from every sector acquire updated technical skills, essential to stay competitive and advance in their careers. Ideal for those who work and seek practical, accessible training that can be immediately applied at work.
Request Free CallI collaborate with business teams that want to introduce or consolidate the use of data analysis and visualization tools. The courses are ideal for departments like marketing, finance, operations, HR and IT that seek technical training, oriented to concrete use and integrable into daily workflows.
Request Free CallI help acquire concrete technical skills, such as Power BI, Python and Data Analytics, often not covered in university programs. For those who want to enter the job market with an updated profile, already in line with company requirements.
Request Free CallTips and practical examples on Power BI, Python and Excel: discover the videos from my YouTube channel.

Discover the advantages of Power BI over Excel for more effective and scalable data analysis.
How to transform default Power BI matrices into professional, high-impact visualizations.
Extract data from images and PDFs directly into Excel without typing a single value.
Testimonials: when quality training makes the difference
Power BI senza fronzoli: esempi veri di lavoro e trucchi utili. Ho passato la PL-300 pochi giorni dopo.
Partivo da zero su Python e non sono mai stata una smanettona: ora riesco a pulire i dati con pandas senza panico. Barbara è stata super paziente.
Con il corso di Power BI ho migliorato i miei modelli dati. Mi sento pronto per la PL-300.
Automatizamos reportes y ahora tenemos más tiempo para discutir ideas. Si dudas, apúntate: compensa rápido.
Con Power Query ho smesso di aggregare CSV ogni lunedì. Report aggiornati in un click. Grazie!
Corso fatto bene, dritto al punto e tanta concretezza. Consiglio!
Power BI con ejemplos de verdad, no diapositivas. Por fin entiendo relaciones y medidas.
Formazione molto solida e orientata al risultato. Insegnante preparata e con piena padronanza della materia.
Excel + Power BI redujeron el tiempo para hacer los informes semanales. Si estás indeciso, simplemente hazlo.
Corso Power BI molto pratico. Ho faticato su CALCULATE all’inizio, ma ora finalmente capisco cosa sto facendo!
Il corso é ottimo ma le 5 stelle sono per Barbara! Bravissima e sempre disponibile.
El curso de Power BI me llevó directo a aprobar la PL-300. Los casos prácticos fueron clave para consolidar DAX y modelado.
Barbara è una trainer fantastica: tanti esempi, ritmo perfetto e tanta pazienza.
Ora con Excel risparmio davvero un sacco di tempo! Ottimo corso.
Python por fin me hizo clic. Barbara explica sencillo y cercano.
Report di vendite finalmente chiari per tutti. Se ci state pensando, fate il corso!
Con Python pasé de “¿qué es pandas?” a limpiar datasets feos sin drama. Barbara tiene mucha paciencia, se nota. 5 estrellas!
5 giornate intense ma utilissime per impara l'analisi dati con Python. Consigliato!


Take a look, the answers await you!